The demand for the tool/ technology changes w.r.t time. An employee in the industry does have great value if the employee gets updated with the trending tool/technology today. Even though DevOps introduced over a decade, the demand for these DevOps tools gets varies w.r.t time. This DevOps suits best for all people in the IT industry. Today people taught that DevOps is a tool/ technology in the IT Industry. But if you too belong to the same category then you are mistaken. Actually
DevOps is defined as the set of principles which combines the development team as well as the operations teams to work together.
The main motto of these DevOps principles is to shorten the software development life cycle and to provide continuous delivery with high software quality. It is responsible to accelerate the application development and services at a high speed.
Click the following link to get in-depth knowledge on What is DevOps? Watch this video on YouTube
Since, we have got a brief idea regarding DevOps, now its time to discuss the top 10 DevOps tools to learn in 2020.
It is the Distributed Version Control System. it is the most commonly used source code management(SCM) tool. It is responsible to track the changes in your file. This tool allows you to easily coordinate with the various versions of the file systems. It is also responsible for easy integration with other popular project management software. The major advantage of this system is that we can easily roll back to the previous versions if we found the issue (or) the bug in the current file systems. Moreover, the main advantage of this file system is the developers can write the code in their own developer environment without concerning the production environment.
The following graph shows the utilization of GIT from the past one year.
Get more information on GIT through our DevOps tools Tutorial
9.Jenkins:
It is a continuous integration server written in Java. This tool suits best for testing and reporting the changes in real-time. This tool helps developers to find and solve the bugs in your code. And finally, it is responsible for the automation of testing their build. it ensures developers were not struck up with the dread feedback loop. Moreover, it is majorly responsible for employing continuous integration (CI) automation. Besides, this tool is also capable of integrating with other several DevOps plugins. In simple words, by the integration of any DevOps tool with Jenkins, we can easily automate the entire project workflow. And we can start the integration of this tool with a simple WAR file.
The usage of this tool, over the past year, can be seen with the following diagram.
8.Docker:
It is a container tool which uses a container to package up an application. It packages all the dependencies before shipping the complete container as the single package. Docker platform supports developers with packages. These packages usually contain all the libraries and their dependencies. It majority ensures that the packaged code contains all the prerequisites required to run. It major motto is to easy integration of the code in any production environment. Moreover, this tool supports developers to easily create, package and deploy their code through containers. Usually, containers serve as the lightweight alternative to virtual machines.
The utilization of Docker tool can be seen through the following diagram
7. Puppet:
It is an open-source, configuration management tool. It is responsible for automating the method of inspecting, delivering and operating your software across the software lifecycle. This tool does all those with platform independency. The primary application of puppet is the centralization and automation of the configuration management. This tool is developed using the Ruby language. Besides system management, this tool provides additional features like orchestration, compliance reporting and so on.
The utilization of this Puppet tools is shown in the following graph:
6. Chef:
It is a powerful, configuration management automation tool. With this tool, we can transform the infrastructure into code. This tool is responsible for managing and configuring the multiple servers within your IT infrastructure. It ensures that all the nodes within the IT infrastructure were alive and connected. Besides chef also automatically updates the nodes in the IT infrastructure without the manual concerns. In simple words, it is responsible for maintaining all the nodes live without any downtime. Moreover, if there is a change in the server, the chef will automatically update those changes to the other nodes in the server.
4. Ansible:
Ansible is an open-source tool. This tool provides the simplest ways to automate your apps and IT infrastructure. This infrastructure includes Network configuration, Cloud deployment, as well as the creation of development environments. The major advantage of this tool is that here we can use the YAML templates. This YAML is a simple readable programming language, to enable the automatic repetitive tasks. Besides this automatic repetitive programming tasks enable the effectiveness of Ansible. Besides this tool is responsible for providing stable environments to both developments as well as the operations teams.
The utilization of Ansible tool can be seen with the following graph.
3. Nagios:
This is a powerful monitoring system. This tool enables you and you and your IT infrastructure to identify your problems. Besides this prior identification helps business to stop falling into critical problems. This is responsible for monitoring the complete IT infrastructure. This complete infrastructure includes an application, host servers as well as the business process. Moreover, this tool is also capable of monitoring and testing the plugins with the live servers. It does this process for the application periodically to ensure that the application as desired.
We can observe the utilization of Nagios with the following diagram
2.Kubernetes:
It is a container management tool. It allows developers to logically segregate and package the cluster of containers. Besides this tool also allows developers in automating and scheduling the deployment of containers through the master-slave node arrangement. Moreover, it is also responsible to analyze the slow slave nodes. Besides this analyzation helps to redistribution of nodes in the cluster. And finally, it ensures that all the slave nodes were connected to the master nodes.
The utilization of this Kubernetes tool can see through the following graph.
1.Openshift:
It is one of the most popular Red hat DevOps tool. It is basically an opensource hybrid application PaaS. Moreover, this tool is responsible for providing the platform as a service for developers. Its private cloud is popularly known as Open shift enterprise edition. Besides Open shift foundation includes the Security-Enhanced Linux (SHEL) and Red hat Enterprise Enterprise Linux (RHEL)
Hence with this, I hope you people got enough idea regarding the popular DevOps tools to learn in 2020. In this article, I have provided the theoretical knowledge of popular DevOps tool. You people can get the practical knowledge of these tools from real-time experts at DevOps Online Training
Azure DevOps may be a software system as a service (SaaS) platform from Microsoft that has an end-to-end DevOps toolchain for developing and deploying software. It conjointly integrates with most leading tools on the market and maybe a nice possibility for orchestrating a DevOps toolchain.
What Is CI/CD?
CI/CD may be a method of developing a software system within which you’re able to unharness updates at any time during a property way. When changing code is routine, development cycles are a lot of frequent, meaningful and quicker.
Continuous Integration may be a requirement for CI/CD and requires:
Developers to merge their changes to the most code branch again and again per day.
Each code merges to trigger an automatic code build and check sequence. Developers ideally receive leads to less than ten minutes, so they will keep centered on their work.
The job ofContinuous Integration is to provide a unit that will be deployed. The role of automatic tests in CI is to verify that the unit for the given version of code is safe to be deployed.
In observe of Continuous Delivery, code changes also are endlessly deployed, though the deployments are triggered manually. If the complete method of moving code from the supply repository to production is totally automatic, the method is named Continuous deployment.
The goal of CI/CD is to create the deployment simple enough, safe and quick. In such a context, the chance of introducing major bugs is low. When one thing dangerous will happen, it’s simple to deliver a fix or revert the modification.
YAML is essentially a human-readable structured data formatting. It’s less advanced and ungainly than XML or JSON however provides similar capabilities. It primarily permits you to supply powerful configuration settings, while not having to find out a lot of advanced code types like CSS, JavaScript, and PHP.
The following image will show the steps for how to build Azure Pipeline as code using YAML.
Create Multi-Stage CI/CD Pipelines as Code With YAML in Azure DevOps
Until recently, Azure DevOps had offered separate build and unharness views for its users. This was a bit totally different from pipeline options in different CI/CD tools like Jenkins, wherever if you build a pipeline, it’s one unified expertise.
With the recent updates, they need free unified expertise for the Multi-Stage Pipelines. Currently, one will use a unified YAML expertise and configure Azure DevOps pipelines to try and do CI, CD, or CI and CD together. This not only permits us to regulate the build configuration as a part of the source code however releases likewise.
The following video will show complete steps for Pipelines as Code with YAML for Azure cloud.
Write a Multi-Stage CI/CD Pipeline
Azure DevOps pipelines contain multiple stages. Every stage describes a part of the CI/CD method. They denote a selected milestone within the CI/CD method, for example, building source code, run unit tests, etc.
Stages contain one or additional jobs, that are units of works assignable to a build/release agent. A job contains a linear series of steps. Every step may be an easy task like echo or a complex script or another task concerning third parties like manual intervention etc.
Azure DevOps publishes services which can be used to connect and fetch data from our custom applications. These services are exposed in the form of REST APIs.
There are a lot of REST APIs exposed by Microsoft which can connect to Azure DevOps for various actions. Some APIs help in process customization, some in getting data from Work Items, some will make build and release definitions data available. In this article, I will be discussing a way to fetch the data from work items, write it to a third-party storage and also create a worktime programmatically.
Sometimes the work items data cannot be obtained in the desired form and quantity by executing custom queries. In such cases, we can programmatically fetch work items data and then shape it in the desired form.
Many organizations have third-party applications that use data from work items. For example a TimeSheet application which fetches the efforts related data from Tasks in Azure DevOps. In such a situation, we need a way with which this data can be fetched and stored in the application for further processing.
Sometimes we may have to create worktime for example, an Incident being created in a third-part application like Service Now. There is no direct Ticket as a work item available in Azure DevOps, so we can create it programmatically.
For this article, I am going to get original estimates and completed hours for tasks worktime, for which the state is closed, and then store it in the SQL Azure database. This can later be used by a TimeSheet application to measure the efforts by developers. I will also discuss how to create a work item of type Task programmatically.
Being HTTP GET or PUT operations, REST APIs can be consumed from a browser to fetch data in the JSON format. We can then convert this data to any format we want and process it.
Following are a few examples for fetching details from Azure DevOps.
https://dev.azure.com/{Organization name}/{project name}/_apis/wit/work items/{worktime id}?api-version=5.0 will provide all the data about the specified work item.
We can get all the teams available for the Team Project by using https://dev.azure.com/{organization name}/_apis/teams?api-version=5.0-preview.2
Connect to Azure DevOps
In order to authenticate on Azure DevOps, there are 3 ways available.
One is to create PAT (Personal Access Token), second is by providing basic authentication and third is by using OAuth.
I will use PAT here. We can create this token by using the security tab for the account and selecting New Token option. Provide the name, specify scope and select the duration for the token. Keep it at a safe place to use as and when required.
NuGet Packages
In order to connect to Azure DevOps and work with the REST APIs, we have to refer to multiple NuGet Package. Let us create an application and select Manage NuGet Packages option from Solution Explorer.
Search for Microsoft.TeamFoundationServer.Client in the browse tab and install it (all the required dependencies also gets installed).
For this example, I have created a credentials file in which I am writing the account information, PAT and the connection string for SQL server where I will write the data.
Create Connection and Client for worktime Tracking
VssConnection connection = null;connection = new VssConnection(new Uri("https://"+ account + ".visualstudio.com"), new VssBasicCredential(string.Empty, PAT));WorkItemTrackingHttpClient witClient = connection.GetClient<WorkItemTrackingHttpClient>();
This code connects to Azure DevOps using VssConnection (Microsoft.VisualStudio.Services.WebApi namespace) and uses GetClient method for WorkItemTrackingHttpClient (Microsoft.TeamFoundationServer.WorkItemTracking.Webapi namespace)
Fetch Data from Azure DevOps
Now that we have established a connection with required credentials to Azure DevOps, we can fetch the data.
As we are interested to get the entries related to the efforts put in by developers while working on tasks, we need worktime specific data. For that we need to declare WorkItemTrackingHttpClient as already mentioned. We will now create a worktime query in wiql (worktime query language). It is similar to SQL query which specifies work item fields to be selected, any conditions to be given and the data can be fetched as a wiql object. In this example, the query just fetches worktime ids for the current team project and worktime types in category of Requirements
Create wiql Query
Wiql wiql = new Wiql();wiql.Query = "SELECT [System.Id] FROM Work Items WHERE [System.TeamProject] = '"+ <Team Project name> + "' AND [System.WorkItemType] IN GROUP 'Requirement Category' ";
I have to create a query which fetches details like original estimate, completed hours, who the task is assigned to, and where the state is closed. As I am fetching the data for original estimate, I have used the Team Project based on Agile process.
This query is as follows:
wiql.Query = "SELECT [System.Id], [System.Title], [System.AssignedTo], [System.State], [Microsoft.VSTS.Scheduling.OriginalEstimate], [Microsoft.VSTS.Scheduling.RemainingWork] FROM Work Items WHERE [System.WorkItemType] = 'Task' AND [System.State] = 'Closed' AND [System.TeamProject]='"+ <Team Project name> + "'";
There is a method called OpenQueryByWiqAsync which will fetch the data. The data sent is in json format, you can then convert it the way you want and display or process it. In this case, I have obtained the data for original estimate, completed hours, title for the task and who it is assigned to. I am also storing the data in a SQL Azure database.
The code for fetching and processing data looks as below:
I have declared variables like OriginalEst for getting data.
Store the data to SQL Azure Database
Create a database in SQL Azure and add a table in it named TimeSheetData with following structure:
Now we need to store the data so it can be then processed further by a TimeSheet application. The code to store in database is very straightforward as follows”
With this remaining code snippet I have completed processing of the data fetched from work items from Azure DevOps and stored it in SQL Azure.
Create Work Items programmatically
Let us see how to write the code for creating the work items programmatically.
Sometimes it may be required to create work items on the fly. One case can be creating spawning of requirements into task every time we create a requirement worktime. You can capture the event of creating worktime in Azure DevOps by using service hook which in turn triggers an azure function which creates the required work items. I have written a series of this long time back. In this case, I will create a small console application which will show how to create work items.
Provide Title for worktime
In this case too, we need to create connection to AzureDevOps. We also need to set a reference to JSonsoft.
var document = newMicrosoft.VisualStudio.Services.WebApi.Patch.Json.JsonPatchDocument();document.Add(newMicrosoft.VisualStudio.Services.WebApi.Patch.Json.JsonPatchOperation(){Path = "/fields/System.Title”,Operation = Microsoft.VisualStudio.Services.WebApi.Patch.Operation.Add,Value = <value>});
Finally, we can call the method CreateWorkitemAsync
var worktime = workitemClient.CreateWorkItemAsync(document, <Team Project name>, <type of work item>).Result;
Similar to this example, we can provide all the required fields (AreaPath, AssignedTo, Description etc) for the work item before we can actually save it. Microsoft has provided a lot of methods with which we can create related work items by providing links (links can be parent child or predecessor successor or just plain related link) or create attachments for the worktime.
These REST APIs can also be used in case we need to migrate work items from on premises TFS to Azure DevOps. In such a situation, we need to first read the work items from TFS and then replicate it in Azure DevOps. There is a utility to do this but sometimes TFS may contains some customization which cannot be migrated with the tool. So, we need to do this programmatically. We can even migrate the whole history for the work items.
Conclusion
In this tutorial, we have seen how to use REST APIs to connect to Azure DevOps, fetch data for work items and finally how to create work items.
Preparing for AWS DevOps Engineer Professional certification exam? We’ve got you covered with the AWS DevOps Engineer Professional Certification Preparation guide. In this article, you will also get a brief on AWS DevOps certification cost, AWS DevOps certification training, and AWS Certified DevOps Engineer Professional salary.
Before moving to the AWS DevOps Engineer Professional Certification Preparation guide, let’s start with an introduction to the AWS Certified DevOps Engineer Professional certification exam. This exam validates the knowledge of an individual in
Managing and implementing the applications on the AWS platform.
Operation of distributed application system on the AWS platform.
Designing and deployment of the logging systems using the AWS platform.
Designing and maintenance of Automate Operational AWS services.
Authorizing automate security tools using AWS networking functions.
Implementation of Compliance Validation and Security Control.
Deployment of Monitoring and Metrics features or systems on AWS platform.
Implementing, troubleshooting, availability, and scalability of AWS systems.
An AWS DevOps professional engineer who has expertise in Amazon Web Services and has passed AWS Cloud Practitioner or any of the Associate level certification exam can start preparing for the AWS Certified DevOps Engineer Professional Certification Exam. It is mandatory to cover all the eight above mentioned objectives for the exam including associate level developing concepts during AWS Certified DevOps Engineer Professional Certification preparation.
Candidate’s Overview: If you are interested in the AWS Certified DevOps Engineer Professional exam, then you must check the eligibility for this exam.
No Prerequisites
Two or more years’ experience provisioning, operating and managing AWS environments
You must have knowledge of at least one high-level programming language.
Experience in automation and testing via scripting or programming
Agile Knowledge along with its processes & methodologies.
AWS Certified DevOps Engineer Professional Exam Information
Here is an overview of the AWS Certified DevOps Engineer Professional Exam –
Certification Name: AWS Certified DevOps Engineer Professional Certification
Exam Pattern: Multiple Choice, and Multiple Answer Questions
Pre-requisites: No Prerequisites
Duration of Exam: 170 Minutes
Registration Fee: $300
Exam Language: English
Validity: 2 Years
Step by Step Guide for AWS DevOps Engineer Professional Certification Preparation
“Success is the result of preparation, perfection, and hard work.” Thus, it is necessary to prepare well for the exam and so there is the need for good AWS DevOps Engineer Professional Certification Preparation. Now, we will cover step by step preparation guide on how to crack the AWS Certified DevOps Engineer Professional Certification Exam.
On reading this article, you will get a good knowledge about where to start and prepare from, to pass AWS DevOps Engineer Professional exam. In case of any query, you can also share your comment below, we’ll get back to you.
So, let’s begin the AWS DevOps Engineer Professional Certification preparation steps –
Get Familiar with Exam Blueprint
Obtain AWS Training course
Study AWS Whitepapers
Check Documentation and Read the Recommended books
Check Sample Questions and Take Practice Exams as well as Watch Online Videos
Exam Registration to get the certification
1. Get Familiar with Exam Blueprint
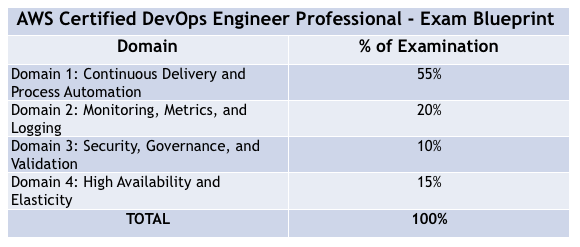
Getting familiar with the Exam Blueprint is the key start to achieve good for every IT certification. It is suggested to have an aspect at the official exam guide. You can find the Blueprint for AWS Certified DevOps Engineer Professional Certification Exam on the official website of AWS. The table below lists the domains measured by this examination and the extent to which they are represented:
Establish an understanding of application lifecycle management
Continuous Delivery and Process Automation
– Application deployment management policies such as rolling deployments and A/B.
– Version control, testing, build tools and bootstrapping.
Validate an understanding of structure formation and automation.
Implement and achieve continuous delivery processes using Amazon web services.
Develop and accomplish scripts and tools to program operational tasks using the AmazonWeb Services SDKs, CLI, and APIs.
Monitoring, Metrics, and Logging
Monitor accessibility and performance.
Monitor and manage billing and budget optimization procedures.
Aggregate and examine infrastructure, Operating System and application log files.
Use metrics to drive the scalability and health of infrastructure and applications.
Analyze data composed from monitoring systems to distinguish application patterns.
Manage the lifecycle of application and infrastructure logs.
Control the AWS SDKs, CLIs, and APIs for metrics and logging.
Security, Governance, and Validation
Implement and manage Identity and Access Management and security controls.
Implement and manage security for data in-flight and at rest.
Implement, program and authenticate cost controls for AWS resources.
Implement and achieve automated linkage security and checking.
Apply the suitable Amazon Web Services account and billing set-up choices based on business requests.
Implement and manage Amazon Web Services resource auditing and validation.
Use Amazon Web Services to implement IT governance policies.
High Accessibility and Resistance
Control suitable use of multi- Accessibility Zone versus multi-region designs.
Implement self-healing application designs.
Implement the aptest front-end scaling architecture.
Implement the most suitable middle-tier mounting architecture.
Implement the aptest data storage mounting architecture.
Validate an understanding of when to properly relate vertical and horizontal mounting options.
2. Obtain AWS Training Course
The next step in the AWS Certifed DevOps Engineer Professional certification preparation is to obtain an AWS training course that will help you understand the designs on the AWS platform especially to develop and sustain applications. The course will brief the principles along with the concept of the DevOps methodology and you will observe use cases connected to enterprise companies.
Course Objectives:
Design and Implement infrastructure to learn the concepts of AWS along with DevOps methodology.
Use of AWS Cloud Formation & AWS OpsWorks.
Design & Implement AWS CodePipeline use.
use cases in AWS technologies.
Differentiation between the technologies available on AWS.
Patch Management’s use in AWS.
Use of AWS tools and technologies
Pre-requisites:
Operations and Development on AWS Platform
Understanding with work experience in one or more programming languages such as Python or Ruby on Rails.
Knowledge of Operating systems such as Windows or Linux
Good understanding with work experience of AWS Command Line Interface (AWS CLI) and AW”S Management Console.
3. Study AWS Whitepapers
The AWS Whitepapers section ensures a number of technical Amazon Web Services whitepapers for integration, delivery, and management. Some of the white papers that are recommended for the professionals during the AWS Certified DevOps Engineer Professional Certification preparation are –
Organizing Containerized Microservices on AWS
Microservices on Amazon Web Services
Infrastructure as a Code (IaaS)
Constant Integration Involvement
Continuous Delivery on AWS
Jenkins on Amazon Web Services
By using PowerShell, Importing of Windows Server to Amazon EC2
Green/Blue Provisions on AWS
Introd to DevOps on AWS
Test and Development on AWS
4. Check Documentation and Read the Recommended Books
The AWS documentation gives you complete information about the services. You will get here enough information about the services from the basic introduction to the high-level and advanced features. There are different categories of the services so choose the required one to get the details.
So, when you have gone through all the official study resources, it is the right time to read some good AWS books. For AWS DevOps Engineer Professional Certification Preparation, there are several books that cover the various objectives of the AWS Certified DevOps Engineer Professional Certification Exam. You can read one or more books that cover all the exam topics. Few recommended books are –
Implementing DevOps on AWS by VeselinKantsev
Practical DevOps by Joakim Verona
Effective DevOps with AWS by Nathaniel Felson
5. Check Sample Questions and Take Practice Exams
When you are done with your preparation, it’s the time to check your preparation level with AWS Certified DevOps Engineer – Professional Certification Exam Free Sample Questions. These free questions will help you get an idea of the exam pattern of the actual exam.
Practice is the key point for perfection. When you are done with all the preparation, just focus on practice. Check online practice papers for the AWS Certified DevOps Engineer – Professional Certification Exam.
In case, if you are a self-learner, For AWS DevOps Engineer Professional Certification Preparation Online Training videos are good to prepare for the exam.
6. Exam Registration to Get the Certification
So, all set? If you are prepared enough then why to delay? Get ready to register for the exam and create an AWS Certification account on the official website of Amazon Web Services. After taking this certification, you can also avail the benefits of this certification. In short, this will help you to access, view and manage your certification.
Average AWS Certified DevOps Engineer Professional Salary
A certified AWS DevOps Engineer earns more than a non-certified AWS DevOps Engineer. As per the Global Knowledge platform, Average AWS Certified DevOps Engineer Professional salary is 125,743 USD per Annum.
Summing Up
“There is no competition for the real world involvement in the Amazon Web Services domain”. If you are the self-learner kind of person and want to cover theory and practice both, all you need to do is focus on your training, more on weak areas, and gain considerable experience in Amazon Web Console. Hope after reading this article, you will learn more about AWS DevOps Engineer Professional Certification Exam, AWS DevOps Engineer Professional Certification Preparation, AWS DevOps Certification Training, and average AWS Certified DevOps Engineer – Professional salary.
Create test plans and test suites to track manual testing for sprints or milestones. That way, you can see when the testing for a specific sprint or milestone is complete. For more information about manual testing,
What are the test plans, test suites, and test cases?
Azure Test Plans or the Test hub in Azure DevOps Server provides three main types of test management artifacts: test plans, test suites, and test cases. These elements are stored in your work repository as special types of work items. You can export and share them with your team, and benefit from close integration for all of your DevOps tasks.
Test plans group test suites and individual test cases together. Test plans include static test suites, requirement-based suites.
Test suites group test cases into separate testing scenarios within a single test plan. Grouping test cases makes it easier to see which scenarios are complete.
Test cases validate individual parts of your code or app deployment. You can ensure your code works correctly, has no errors, and meets business and customer requirements. You can add individual test cases to a test plan without creating a test suite, if you wish. More than one test suite or test plan can refer to a test case. You can effectively reuse test cases without needing to copy or clone them for each suite or plan.
For example, you’re building version 1.* of your product and you might create several test cases for that version. Each of these test cases can be updated, and more added, at any time. For each development cycle and release of your product, you create a test plan and import the existing test cases into that plan. You can also, if you wish, divide the test cases into separate test suites within the plan to enable easier management and monitoring of these separate sets of test cases.
After you create your test plan, you assign test configurations and assign testers to cover the required test matrix. These testers run the tests and gauge the quality of the product. Testers continue testing until the product meets exit criteria. For the next development cycle and release, you can create a new test plan and reuse the same test cases. You repeat this development-test-release cycle by importing the same test cases into each new test plan.
The great thing is that, because test plans refer to test cases, updates to a test case automatically reflect in all the test plans and test suites that use it.
You need a project. For more information, see create your project. Then create your backlog.
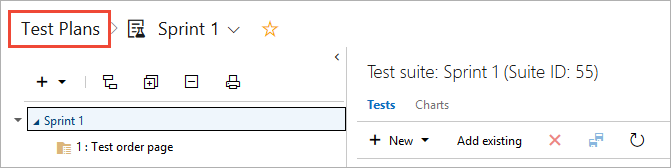
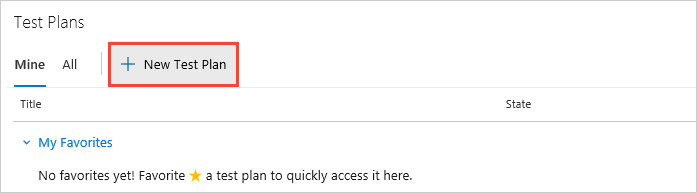
In Azure DevOps Services or Azure DevOps Server, open your project and go to Azure Test Plans or the Test hub in Azure DevOps Server. If you already have a test plan, choose Test Plans to go to the page that lists all test plans.
In the Test Plans page, choose New Test Plan to create a test plan for your current sprint.
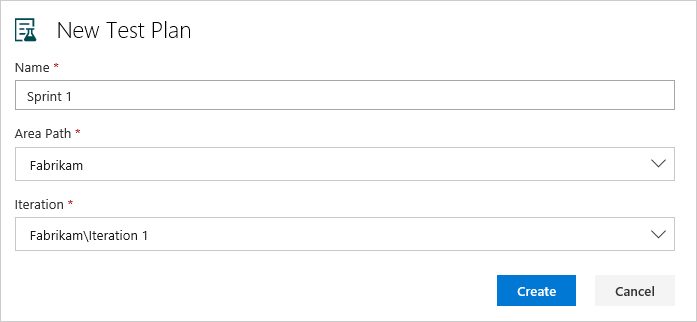
In New Test Plan, enter a name for the test plan. Verify that the area path and iteration are set correctly, then choose Create.
Add a requirement-based test suite and select backlog items to test
Now add test suites for the backlog items that need manual tests. These tests could be user stories, requirements, or other work items based your project.
To add a suite to a test plan, select the + new drop-down list and choose a type of test suite.You use requirement-based suites to group your test cases together. That way, you can track the testing status of a backlog item. Each test case that you add to a requirement-based test suite is automatically linked to the backlog item.
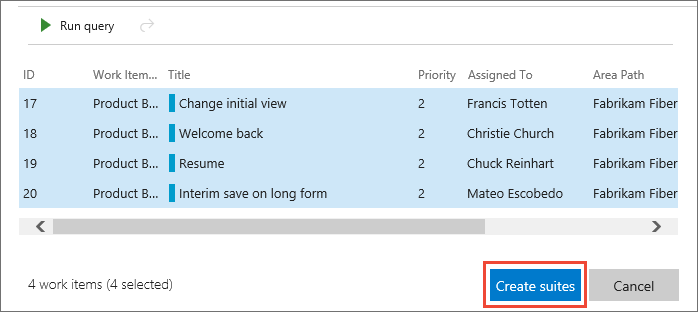
In Create requirement-based suites, add one or more clauses to filter your work items by the iteration path for the sprint. Run the query to view the matching backlog items.
In the list of work items returned by the query, select the backlog items you want to test in this sprint. Choose Create suites to create a requirement-based suite for each one.
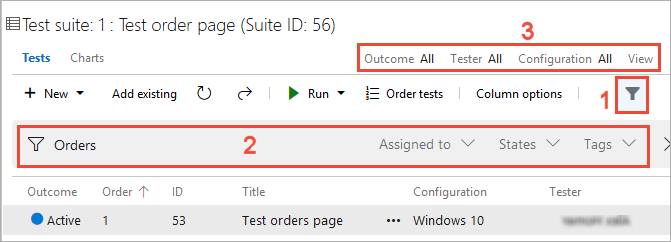
Find a test case in a test plan
In Test Plans for your test plan, use the filter icon (1) to show the search and filter lists (2) that help you find the tests you want to work with. Or filter the list of tests using Outcome, Tester, and Configuration (3).
The demand for the tool/ technology changes w.r.t time. An employee in the industry does have great value if the employee gets updated with the trending tool/technology today. Even though DevOps introduced over a decade, the demand for these DevOps tools gets varies w.r.t time. This DevOps suits best for all people in the IT industry. Today people taught that DevOps is a tool/ technology in the IT Industry. But if you too belong to the same category then you are mistaken. Actually
DevOps is defined as the set of principles which combines the development team as well as the operations teams to work together.
The main motto of these DevOps principles is to shorten the software development life cycle and to provide continuous delivery with high software quality. It is responsible to accelerate the application development and services at a high speed.
Click the following link to get in-depth knowledge on What is DevOps? Watch this video on YouTube
Since, we have got a brief idea regarding DevOps, now its time to discuss the top 10 DevOps tools to learn in 2020.
It is the Distributed Version Control System. it is the most commonly used source code management(SCM) tool. It is responsible to track the changes in your file. This tool allows you to easily coordinate with the various versions of the file systems. It is also responsible for easy integration with other popular project management software. The major advantage of this system is that we can easily roll back to the previous versions if we found the issue (or) the bug in the current file systems. Moreover, the main advantage of this file system is the developers can write the code in their own developer environment without concerning the production environment.
The following graph shows the utilization of GIT from the past one year.
Get more information on GIT through our DevOps tools Tutorial
9.Jenkins:
It is a continuous integration server written in Java. This tool suits best for testing and reporting the changes in real-time. This tool helps developers to find and solve the bugs in your code. And finally, it is responsible for the automation of testing their build. it ensures developers were not struck up with the dread feedback loop. Moreover, it is majorly responsible for employing continuous integration (CI) automation. Besides, this tool is also capable of integrating with other several DevOps plugins. In simple words, by the integration of any DevOps tool with Jenkins, we can easily automate the entire project workflow. And we can start the integration of this tool with a simple WAR file.
The usage of this tool, over the past year, can be seen with the following diagram.
8.Docker:
It is a container tool which uses a container to package up an application. It packages all the dependencies before shipping the complete container as the single package. Docker platform supports developers with packages. These packages usually contain all the libraries and their dependencies. It majority ensures that the packaged code contains all the prerequisites required to run. It major motto is to easy integration of the code in any production environment. Moreover, this tool supports developers to easily create, package and deploy their code through containers. Usually, containers serve as the lightweight alternative to virtual machines.
The utilization of Docker tool can be seen through the following diagram
7. Puppet:
It is an open-source, configuration management tool. It is responsible for automating the method of inspecting, delivering and operating your software across the software lifecycle. This tool does all those with platform independency. The primary application of puppet is the centralization and automation of the configuration management. This tool is developed using the Ruby language. Besides system management, this tool provides additional features like orchestration, compliance reporting and so on.
The utilization of this Puppet tools is shown in the following graph:
6. Chef:
It is a powerful, configuration management automation tool. With this tool, we can transform the infrastructure into code. This tool is responsible for managing and configuring the multiple servers within your IT infrastructure. It ensures that all the nodes within the IT infrastructure were alive and connected. Besides chef also automatically updates the nodes in the IT infrastructure without the manual concerns. In simple words, it is responsible for maintaining all the nodes live without any downtime. Moreover, if there is a change in the server, the chef will automatically update those changes to the other nodes in the server.
4. Ansible:
Ansible is an open-source tool. This tool provides the simplest ways to automate your apps and IT infrastructure. This infrastructure includes Network configuration, Cloud deployment, as well as the creation of development environments. The major advantage of this tool is that here we can use the YAML templates. This YAML is a simple readable programming language, to enable the automatic repetitive tasks. Besides this automatic repetitive programming tasks enable the effectiveness of Ansible. Besides this tool is responsible for providing stable environments to both developments as well as the operations teams.
The utilization of Ansible tool can be seen with the following graph.
3. Nagios:
This is a powerful monitoring system. This tool enables you and you and your IT infrastructure to identify your problems. Besides this prior identification helps business to stop falling into critical problems. This is responsible for monitoring the complete IT infrastructure. This complete infrastructure includes an application, host servers as well as the business process. Moreover, this tool is also capable of monitoring and testing the plugins with the live servers. It does this process for the application periodically to ensure that the application as desired.
We can observe the utilization of Nagios with the following diagram
2.Kubernetes:
It is a container management tool. It allows developers to logically segregate and package the cluster of containers. Besides this tool also allows developers in automating and scheduling the deployment of containers through the master-slave node arrangement. Moreover, it is also responsible to analyze the slow slave nodes. Besides this analyzation helps to redistribution of nodes in the cluster. And finally, it ensures that all the slave nodes were connected to the master nodes.
The utilization of this Kubernetes tool can see through the following graph.
1.Openshift:
It is one of the most popular Red hat DevOps tool. It is basically an opensource hybrid application PaaS. Moreover, this tool is responsible for providing the platform as a service for developers. Its private cloud is popularly known as Open shift enterprise edition. Besides Open shift foundation includes the Security-Enhanced Linux (SHEL) and Red hat Enterprise Enterprise Linux (RHEL)
Hence with this, I hope you people got enough idea regarding the popular DevOps tools to learn in 2020. In this article, I have provided the theoretical knowledge of popular DevOps tool. You people can get the practical knowledge of these tools from real-time experts at DevOps Online Training
I hope you people have successfully launched instances in your AWS Environment. So let’s move to the actual DevOps tools. Initially, we will start with GIT. Prior to knowing about GIT, let us consider the following scenario to know the need of GIT
Scenario:
Application development will not happen in a single instance. So prior to the launching of the application, the application undergoes several changes. So while making these changes, there may be a chance for application to be hanged at some point. Hence, if we nullify that recent change, the application may work well. But if we go on updating the same file, we cannot pick at the which point, the application was struck. So it seems for the necessity to have the separate file for each update. Hence, we can easily nullify that recent change for the application to work properly. And the concept of creating the separate file for each update is known as Versioning.
And prior to knowing about the GIT definition, let us initially consider
What is Version Control System?
It is the management of changes to the documents, large programs, large websites and the collection of other information.
This VCS is basically classified into the following types:
This system uses the central server, to store all the files and enables the team collaboration. It works on the single repository, where the users can directly access to the central server.
So if you observe the above system carefully, it consists of the central server. And this central server can be local (or) a remote one. And this can be directly connected to each of the programmer’s work stations. So it clearly indicates that every action was happening with the central repository. And this can update ( addition/ deletion ) as well as the fetching ( Extracting) of data with the central repository. This interaction of individual repository work seems to be fine if everything goes smoothly. But on the other hand, this system has the following problems:
Centralised Version Control System drawbacks:
This system is not available, locally. It means, we need to depend on the internet to update (or) fetch the file from the central repository
Due to any reason, if the central servers are down / crashed, the entire files will be lost.
So to overcome this kind of problems, people prefer other system known as Distributed Version Control Systems (VCS)
Distributed Version Control System:
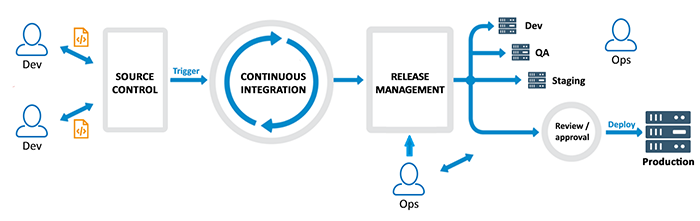
Unline Centralised Version Control Systems (CVCS) it does not rely on the central server to store all the files. In distributed VCS, each contributor has the local copy of the main repository. It means in this file system, everyone maintains the local copy of their files. And the central repository maintains the metadata of all these files.
If the observe the above screenshot carefully, we each repository maintains its own local copy in the systems. So the programmer can update (or) pull the data from the local repository. So thereby it bypasses the necessity of central server along with the mandatory internet connection. Moreover, as shown in the above diagram, the programmer can get the data from the central repository using the pull command. Likewise, it sends the data to the central repository using the push command. And as mentioned above this distributed version Control system (DVCS) has the following advantages over the centralized version control system (CVCS)
Since the programmer needs to access form the local repository, all the operations were very fast Except the pull and push.
Since we were mostly connecting to the local repository, internet connection is not a mandatory thing
sharing of data between the programmers is so easy due to local copies in their repositories
And even though the central repository may be crashed at any instance, they can get the copy from the local repository
So let us move into the actual concept.
What is GIT?
GIT is a Version Control system (VCS) that supports non – linear workflows by providing data assurance for quality software development.
This distributed version control system means, your local copy of code is the complete version of the repository. So this fully functional local repository makes it easy to work offline (or) remotely. Here you can commit the work locally and then sync your copy of the repository with the copy of the server. This system makes the developers work with any team. GIt users community has created many resources to train developers
Every time, you save your work, Git creates a commit. Usually, a commit is a shop shot of all files at any point in time. And if the file has not changed from one commit to the next, GIT uses the previously stored files. And this design differs from the other system that stores the initial version and keeps the deltas over time.
Branches:
Every developer saves changes to the local code repository. So the developer may have different charges based on the same commit. Usually, gits provide the tools for isolating the changes and later merging back together.
Branches were the lightweight process, to work in progress and manage this separation
And once the work is created in the branch, merge it back to your team main branch.
Files and commits:
Usually, the files in gits can be anyone the three stages. This may be modified, staged (or) committed. So when you first modify the file, the changes exist only in your working directory. But this is not yet the part of Commit (or) in the development history. And this staging area contains all the changes that you need to include in your next commit. And once, you are satisfied with the staging files, you can commit the message. Besides, this commit is part of the development of history.
What is the role of GIT in DevOps?
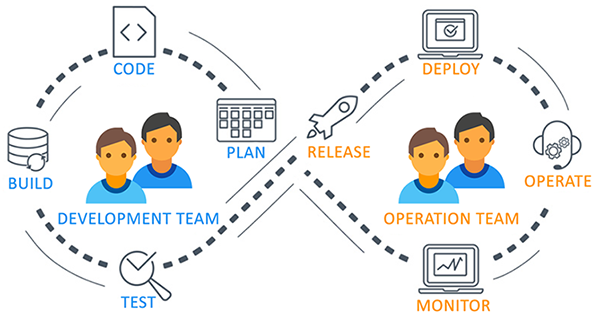
Git is usually an integral part of DevOps. And DevOps is a set of practices that brings agility to the process of development and operations. It is responsible for boosting the project life cycles, and in turn, increases the profits. Besides, it promotes the collaboration between the development engineers and operations.
The above diagram shows the entire DevOps life cycle from project planning to deployment and monitoring. And this Git plays a major role in managing the code, that contributes the collaborators to the shared repository. Moreover, this code is extracted for performing the continuous integration to create the build and test it on the server. Usually, GIT is responsible for making the communication between the teams. Today people cannot see the GIT application for smaller projects. But we can see its application in many of the larger projects. Moreover, we people observe this tool application in a large application. And it is essential to establish communication between the development and operations teams. Here commit messages plays a major role in maintaining communication among team members.
We people can use this GIT on a different platform. So let us see them in detail
Download the file as per your system configuration
step – 3:
Once the file is downloaded, double click on the file and click on Run.
step – 4:
Click on Yes
step – 5:
Click Next
step – 6:
Click on Next
step – 7:
Click on Next
step – 8:
Click on Next
step – 9:
Click on Next
step – 10:
Select the environment path as per your choice and click on NEXT.
step – 11:
Click on Next
step – 12:
Click on Next
step – 13:
Click on Next
step – 14:
Click on Next
step – 15:
Enable the feature and click on Install
step – 16:
Select Launch Git and click on FINISH.
So like this, we can install the GIT in our Windows System. And once, it was installed, we need to created an account in the Git hub. We can create the account in GIT with the following command.
git config – – global user.name “<your name>”
git config – – global user.email “<your email>”
And I hope you people have successfully installed in your system and created an account. And if you struck up anywhere.
So now let’s move on to the Linux platform using Ubuntu
GIT installation on Ubuntu:
In order to see the GIT working on Ubuntu, initially, it is required to have two separate instances (Client and server) And if you were new to instance creation, visit AWS Services in our website. Once you create the instances, follow the below steps
step -1:
Login to your Server instance and know your hostname with the following command.
step – 2:
Update the repositories in your system with the following command
step -3:
Install git in your system using the following command
step -4:
Add/create the user in GIT with the following command
step – 5:
Provide the password for the user that you have created.
step – 6:
Reenter the password
Then you can see the password updation confirmation as shown below
step – 7:
Provide the user name with the following command
step -8:
Provide the rest of the detail as asked below( if want to skip as of now, you can press enter)
step – 9:
Provide the confirmation of the user data as shown below
So git installation and the user creations are completed successfully on server. And now let’s move to the client machine
Client-side configuration:
step -1:
Login to the client machine and know the hostname of your machine using the following command
step – 2:
Connect the server from the client, using the following command
step – 3:
Remove all the data and add the server IP address and save file
step -4:
Likewise, copy the client address in the server machine also
step -5:
Generate the key pair as shown below
step -6:
By default, it shows some default file location of the keypair. And press enter, if you agree to save in that location
step – 7:
Press enter
step – 8:
Press enter
step – 9:
Then you can see the secret key as shown below
step – 10:
Check the available files using the following command.
step – 11:
Check the hidden files in your directory using the following command
step – 12:
Copy the secret key of the client using the following command.
step -13:
Like in the client install the git package in the server and create the user and move to that user using the following command.
step – 14:
check the files in the user account with the following command.
step -15:
If you observe the above screenshot, we don’t have any .ssh file, create the key pair in the server using the following command.
step – 16:
Now again check the files in the server machine.
step – 17:
Change your current working directory to .ssh and check the files in that directory using the following command
step -18:
Select the file to save the key (or) create the new file using the following command. So, now here I’m creating new file name authorized _keys. Then the paste the secret key in that file and save the file. Perform this action from client to server as well as from server to the client. And once it gets done, you can able to connect to the machines. So you can connect to the remote machine using the following command.
ssh git @hostname
Then it will ask you for some confirmation. Once you confirmed, you will be able to connect to the remote machines
Besides this, there is also another to interact with the Git hub. i.e. Generating and pasting the key in Github account. And if you did so, you people can download and upload from git hub to the Ubuntu instance as shown below
Git hub operations:
step -1 :
Generate and copy the public key to your clipboard
step – 2:
Navigate to github.com and sign in to your account ( if you are a new user, then sign up and sign in to the account). And navigate to setting and click on SSH and GPG Keys.
step – 3 :
Click on New SSH Key.
step – 4:
Provide some title and paste the key that you have copied to your clipboard in step – 1 and click on add SSH key.
step -5:
Navigate to github.com and click on your Repositories.
step – 6:
Click on New
step – 7:
Provide and description and click on Create repository
Once you click on create repository you can see the repositories as shown below( i have one additional repository named DevOps).
And now we need to connect to this account from aws account
step – 1:
In the aws instance, Connect to Git hub account user as shown below
step – 2:
Also, provide the email address that is linked to the Git hub as shown below
So like this, we have successfully connected our AWS instance to the Github
step – 3:
So we can see the github repositories through the following command
git clone “repository URL”
step – 4:
check the file and folders in your repository using ls -la
So like this, we can see the complete repository through Linux. And I hope, you people have successfully downloaded your files.
Uploading a file to Github:
step – 1:
As above create a repository ( make sure, you have ticked initialize README.md) during the repository creation. (in this case, I have created the repository DEMO)
step – 2:
Check the available file in your repository
since we have initialized README.md we can able to see this tile
step-4:
Open this file and add some data and then save this file.
step -5:
Add the updated file(README.md) to the git using the following command
step – 6:
Commit the file that you have added
In the above command, you can write anything in between ” “
step -7:
Push the updated file to the git using the following command
So you have successfully updated the file pushed to Github. And if you reload to git hub, you can see the updated file as shown below
And if you click on the file, you can see the updated text. So likewise, we can perform GitHub file operations from AWS instance. And now let us discuss a few of them
Branching:
The term branching can be understood clearly with the following scenario.
Let us consider, where there some file named Test. And now, you have some changes to the original file. But you were not sure of the changes that you were made and not committed to the main server. And we people can able to see all the file versions using branching. This concept usually allows you to move back and forth in a project. Besides, once you are ok with a different version of the file you can merge these files and update that file to the server.
We can create the branch using the following commands from the terminal
step – 1:
Create the branch using the following command
step -2:
Move to the branch using the following command.
So with this command, we will be moving to a branch named branch1. And now add some date to the file and save then push to the master. And the for the updated files in the git hub
Don’t reload the GitHub page twice and thrice, because you cannot observe any kind of changes there until you move and merge this fill with the master
Merge:
This command is used in places, where there is availability for multiple version of the file and interested to merge these file and update this file to the main repository.
So navigate back to the master branch with the following command
Merge the branch with the master using the following command.
Now create a file and add some data and then save and finally commit this file to the git server. Once you committed, you can observe the changes in the git server.
Cloning:
It is nothing but the Downloading option that we use in our daily life. This option lets you get the complete file from the git server to your local machines. once you clone the main repository, you can get all the subfolders as well as the files placed in that repository.
Forking:
A fork is a copy of the repository.
In a real-time scenario, every project is an experiment. So while performing, these kinds of experiments, we may fail in some cases. Moreover, due to this failure, we may also lose the actual option that was available in this project. So it leads to the failure of some data. And at this point, there comes a need to use the concept Forking. This concept usually overcomes these kinds of problems. Moreover, it is essential and I strongly recommend to make a safe copy prior to project experiment.
GIT Features:
Free and open-source:
Git is released under General purpose License ( GPL) open-source license. It is absolutely free and you need to purchase it. And since it is open-source, you can modify the code as per your requirement.
Speed:
Since GIT does not require any network to perform all the operation, it completes all the task really fast. And Mozilla performance test shows that the magnitude order was very fast when compared to other version control systems. Moreover, the fetching history from the local server is 100 times faster than fetching the data from the remote server. And the core part of Git is written in C language.
Scalable:
Git is very scalable. So in future, if the number of collaborators increases GIT can easily handle this change. Even though GIT represents the entire repository, the data stored on the client-side is very small. Usually, GIT compresses huge data using the lossless compression technique.
Reliable:
Since every contributor has its own local repository, on the events of the system crash, the lost data can be recovered with any of the local repositories. So even though the central system was crashed, you can recover those files from the local repository.
Secure:
Git uses SHAH1 to name and identify the objects to name and identify the objects within its repository. Here every file and commit is checksummed. and retrieved by its checksum at the time of retrieving. Moreover, once it was published, it is not possible to change to older versions.
Economical:
In the case of CVCS, the central server needs to the powerful to serve the request of the entire team. And there will be no issue for the smaller teams. But if the team size grows, the hardware limitation of the server will be the bottleneck. And in case of Distributed Version Control system, the developers don’t interact with the server, until they need to push (or) pull the changes. Since in this case, everything is happening on the client-side, there will be a little burden on the server-side.
In Traditional software development, after completing the development part, the code deployment time was huge. And many times, we heard the common fights between the Development Team and Operations Team or deployment team that it works fine on our system, it’s the sever causing problem and operation team defences it’s not your server it’s your code, Right? Well, DevOps solves the Traditional Dev and Ops fights by breaking the wall of confusion.
What is DevOps
DevOpsis Development and Operation’s Collaboration, It’s a Union of Process, People and Working Product that enable continuous integration and continuous delivery of value to our end users. DevOps accelerate the process to deliver applications and software services at high speed and high velocity. So that organizations can learn and Adopt the market at its earliest. Also, it minimizing the risk factor by continuously delivering and getting end-users and stakeholders feedback at the early stages.
DevOps is the practice of operations and development engineers that work together in the entire project lifecycle, from design and development process to production releases and support.
Starting from design and development to testing automation and from continuous integration to continuous delivery, the team works together to achieve the desired goal. People having both development and operations skill sets working together and use various tools for CI-CD and Monitoring to respond quickly to customers need and fix issues and bugs.
Benefits of DevOps
Following are the main benefits of DevOps Practices.
Break down the Silos
I believe the most important benefit using DevOps is to break down the Silos as the Cross-functional development team and operation team works together that is possible due to the self-organized approach of work.
Speed
Delivering the highest business value item quickly and faster product delivery in the market as DevOps follows Agile Principles.
Rapid Delivery
Frequently release the working product in the market to satisfy the market and more importantly customers need, that improves the ROI (Return on investment).
Reliability
By following DevOps best practices and using the best tool for Continuous Integration, Testing Automation, and Continuous Delivery and monitoring the logs helps the team to stay updated and take the real-time decision quickly.
Team Collaboration
DevOps improves the collaborations between the Dev Team and Ops Team, Team works together towards the common business goal. DevOps Break the silos and focus on Communication, Transparency, Inspection, Adaption, and Integration.,/p>
Security
While implementing automation Security is a very important factor, By Following DevOps model and using Infrastructure as code and by doing automation of process and compliance policies, one can take control security configuration.
Risk Management
Using this practice we can Identify the risk factor early in the application lifecycle stages. Early detection of any issues or bug and quick correction or fixes helps to stay ahead in the competition.
Why DevOps Matters?
In today’s competitive software Industry, Automation and AI plays a major role and to stay ahead in the market and attract your stakeholders and customer we must transform and adapt the DevOps Best Practices. So Why you need DevOps in First place, Well
To stay ahead in the market as competitors are already doing this.
To increase velocity of the team as well as product delivery.
To reduce downtime and within a minimum time limits, update the changes on the production.
To reduce human error by doing all work automated.
In any company the transformation from Waterfall to Agile and Agile to DevOps we first must work on the people’s mindset as I Explain that it is not a job or tool but it is a mindset. The team must work together and make their communication smooth, work more collaboratively and take the responsibilities to achieve the goal. The team must trust each other and maintain transparency. Second important things are to identify the tools that best suit for your project in terms of planning, code management, testing automation, continuous integration, continuous deployment and monitoring and start using that you can also go for Infrastructure as Code, to sum up, automate everything you can.
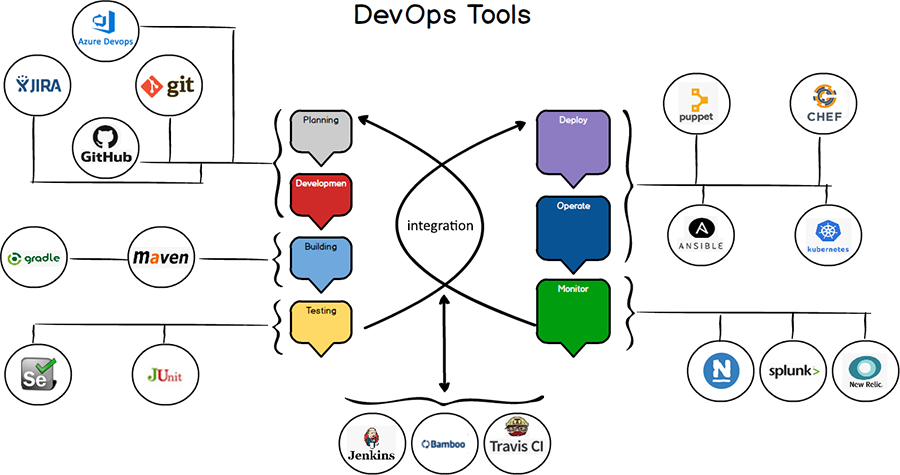
DevOps Tools
Following are the categories and Tools using that you can manage DevOps Practices.
Planning : You can use Jira or Azure DevOps Board for manage and plan your work in an Agile way
Development : Fo code management, Git is the number 1 tool to manage your Code version History, branches, Push and Pull mechanism as a distributed way. You can also use Microsoft TFVC (Team Foundation Version Control) which is a Centralized version control system.
Testing : For automate your testing you can relies on Selenium, JUnit and Apache JMeter.
Build, Deploy and Integration
For Integration we can relays on Jenkins, Travis CI or Bamboo, to manage your application builds and based on your application need we can use Maven or Gradle for Building and accelerating development and productivities. You can also go for Docker, Kubernetes, Chef, Ansible, and Puppet which are very famous tools for the deployment.
Operating and Monitoring
Once your product is in right place, Operating and continuous monitoring play a major role here, and for that, we can use Nagios, Splunk or New Relics. Using that one can manage Servers Networks and Application.
Summary
DevOps is the talk of the town but many companies or Individuals had a wrong interpretation that, DevOps is a job? Or DevOps is a Software Product? DevOps is a concept with different interpretations and definitions, but when you get down to it, it’s all about developers and operations team working together to achieve the common goal.
In Azure DevOps I needed to determine a variable in one deployment stage, and use it in another. I remember finding and implementing this solution before but couldn’t figure out how I did things, so this post is for me to find it easier next time 😉.
For example, in a stage I want to set a variable with the name ReleaseVariableName to a value. Searching online points you to an example on how to do this with for example the PowerShell command below. You first create a variable in the variable tab and then set/overwrite its value:
Note that you don’t necessarily need to create variable, Azure DevOps does that for you. But it helps in figuring out what is happening later on.
The issue
Testing the code above will prove that this works, but that the variable values are reset in a new Agent Job or another Stage. This stems from the fact that each job or stage can be run on a different Agent (and even in parallel) and that the values are not synced across.
The fix: use the REST API for Azure DevOps
The only way I found to update the variable value is to use the REST API for Azure DevOps, find the current release we’re in and then overwrite the variable value there. Then the next Stage / Job will pick up the new value and you can continue.
Do note that this updated value will not be available with this in the same stage as you’re updating it in! Handle that separately.
Note: you will need to set the Job you are running this in to have access to the OAuth Access Token:
Even easier, download the Task Group definition
Making implementing this even easier, you can download my exported Task Group here and import it (after reviewing it for security issues of course!) into your own environment.
Authorization for the Service account you are using
Good to note that you need Manage Releases with the service you are running the deployment pipeline with, otherwise you will run into an error like this:
VS402904: Access denied: User Project Collection Build Service (AzDoServiceAccountName) does not have manage releases permission. Contact your release manager.
Future Azure DevOps update
There is a new update for Azure DevOps on its way to make this even easier as noted by the Azure DevOps team here. You can see that the initial issues was created in 2017 and the solution is rolling out in 2020 😄.
Update for yaml pipelines
After reading this blog post, Sebastian Schütze new about another way to fix this issue in a yaml pipeline: you have the option there to upload an artefact from the pipeline that can be downloaded in any subsequent stage/job.Sebastian Schütze @RazorSPoint
I wanted to check to see if I could replicate the behavior in a classic pipeline and it all seemed good: there is a Publish Pipeline Artifact task available that is meant just for cases like this.
You can then retrieve the file in the next stage/job and read it back in…. Or so was the plan:
The Upload Artifact task cannot be run in a release pipeline! 😠💩 It has been added to the documentation, but why they then show the task as being available and all, is beyond me. There have been more people who want this to work, as you can find in this GitHub issue.
There is an option to upload a file to the release pipeline, but then you cannot download it again:
Because things can go wrong with the cloud service, an easy way to determine where the problem is occurring is to use the Service Health Dashboard.
Although Amazon Web Services (AWS) is generally reliable, things can and occasionally do go wrong with the service. When that happens, administrators must be able to determine whether the problem is on the AWS end, or if the problem is related to something that’s within the administrator’s control. One of the best sources of information in these situations is the Service Health Dashboard.
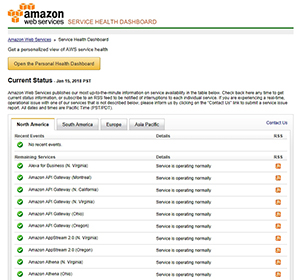
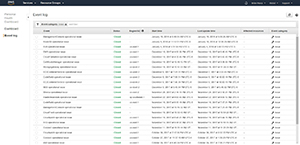
The Service Health Dashboard is relatively well hidden within the AWS interface. You won’t find it on the list of services. One way of accessing the Service Health Dashboard is to simply enter the word Health into the search box. Another option is to log into the AWS console, and then enter the Service Health Dashboard’s URL: http://status.aws.amazon.com. You can see what the Service Health Dashboard looks like in Figure 1.
[Click on image for larger view.]Figure 1. The AWS Service Health Dashboard.
As you can see in the figure, the top portion of the Service Health Dashboard lists the various AWS services by region, along with an indication of the service’s health. In this case, everything is functioning normally.
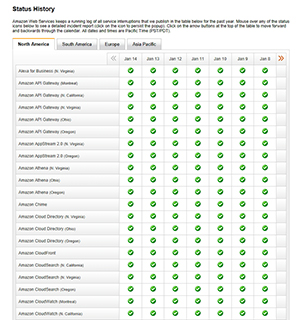
If you scroll further down the page, you’ll find the Status History section, which you can see in Figure 2. Like the Current Status section, this section lists each of the AWS services. However, this section allows you to see if any service health problems have recently occurred. In this particular case, everything appears to have been healthy over the last few days.
[Click on image for larger view.]Figure 2. None of the services are reporting recent health problems.
One thing you’re sure to notice with these lists is that Current Status and Status History both provide an overwhelming amount of information. One way that you can make the health information a bit easier to digest is by using a Personal Health Dashboard.
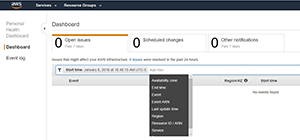
If you look back at Figure 1, you’ll notice that the interface contains a big yellow button labeled Open Personal Health Dashboard. You can see what the Personal Health Dashboard looks like in Figure 3.
[Click on image for larger view.]Figure 3. The Personal Health Dashboard.
As you initially look at this screen, it may seem a bit underwhelming. However, that’s mostly because no issues have recently been reported. Even so, let’s go ahead and explore the dashboard’s contents.
As you can see in the Figure 3, the most prominent feature of the Personal Health Dashboard is the series of tabs that runs along the top of the screen. These tabs allow you to view open issues from the last seven days, scheduled changes and any other notifications from the last seven days. It’s worth noting that these tabs automatically refresh every minute or two, so the information displayed should be relatively current.
In Figure 3, the Open Issues tab is selected. Although there aren’t any issues to report, you can see that the lower portion of the screen would display the event, region, start time, last update time and any affected resources.
Another thing that’s worth taking a look at on this screen is that just above the empty list of events is a box that says Start Time. This box is actually a filter. By default, the list is being filtered by start time, but you can filter the list based on other criteria such as availability zone, service or region. You can see some of the available filters in Figure 4.
[Click on image for larger view.]Figure 4. There are a number of filters available.
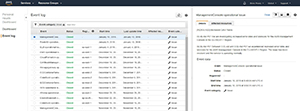
Keep in mind that you don’t have to view the list in a filtered format. Filtering usually makes it easier to parse the information and find exactly what you’re looking for, but it is possible to see a full, unabridged list of issues instead. To do so, click the See All Issues link, shown in Figure 5 (or just click on the Event Log).
[Click on image for larger view.]Figure 5. The Event Log shows you all recent issues.
As you browse the Event Log, you can use filtering to narrow down the list of issues. In Figure 4, for example, the list was filtered by event category. In this case, events with a category equal to Issues are displayed. You can revise this filter, or filter on a different set of criteria.
If you want to see more information about a particular issue, simply click on the item within the list. The right side of the screen will display detailed information about the issue, as well as its status and when the issue began and ended. As you can see in Figure 6, there’s also a tab that you can use to determine which resources were affected by the issue.
[Click on image for larger view.]Figure 6. You can view detailed information related to each issue.
By and large, AWS is stable and reliable. However, if you ever do experience problems, the Service Health Dashboard is a great place to begin your troubleshooting efforts.


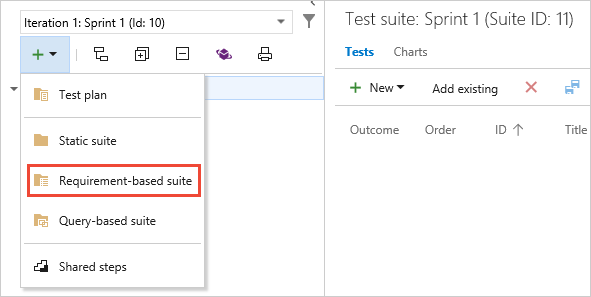 You use requirement-based suites to group your test cases together. That way, you can track the testing status of a backlog item. Each test case that you add to a requirement-based test suite is automatically linked to the backlog item.